OrbView-3 High Resolution Images of Pakistan for Free

on February 12, 2012

OrbView-3 high resolution imagery of Pakistan is now available in public domain since January 9, 2012. The images in this catalogue have been acquired between 2003 to 2007 and include more than 2400 scenes with the resolution of 1 meter (pan) and 4 meters (multispectral) of different place in Pakistan. Map below shows coverage of the available images. One can access it via USGS's EarthExplorer as well.Orbiew-3 Coverage Pakistan

Orbiew-3 Coverage Pakistan2

Download KML file of the Coverage HERE:

An analysis of mapping potential from OrbView 3 Images is given below (extracted from GIM International)

Information Content of High-resolution Satellite Image

The information content of OrbView-3 and Ikonos imagery is compared, using the Zonguldak area in Turkey as test area. Although OrbView-3 images are qualitatively slightly inferior to Ikonos panchromatic scenes, they can be used for the generation of topographic maps at scale 1:10,000. However, they are not suited for 1:5,000 mapping, for which scale Ikonos images also show limitations.

In operation since 2004, OrbView-3 is one of the recent very high-resolution space sensors, offering images of 1m panchromatic and 4m multispectral Ground Sampling Distance (GSD). In mapping terms both geometric accur-acy and information content are important, but the required geometric accuracy can be reached without difficulty provided that images are not degraded by at-mosphere and sun-elevation effects. As a rule of thumb, the GSD should be at least 0.1mm of the map scale, corresponding to scale 1:10,000 for 1m GSD.

Visual Comparison
Examination of information content has to be done by visual inspection (Figure 1). OrbView-3 and Ikonos have approximately the same resolution, but comparison shows that edges are sharper in the Ikonos image and that whilst OrbView-3 shows cars only as blobs, structural elements are visible in Ikonos. The GSD of 0.62m offered by QuickBird enables identification of more detail. On the other hand, the 5m GSD of Spot 5 limits the use of these images to the creation of maps of smaller scale. Buildings are still visible but they cannot be mapped in detail, and sometimes back-gardens will be identified as streets. Many of these differences result from sensor configuration, radiometric resolution, recording conditions and terrain characteristics.

Sensor Configuration
OrbView-3 uses staggered CCD-lines; two CCD-lines are shifted by 0.5 pixels against each other so that the pixel size projected on the ground for nadir view is 2m and adjacent pixels overlap 50% in both directions (Figure 2). The effective GSD of 1m resulting from such over-sampled pixels differs from nominal GSD of 1m. OrbView-3 takes 2,500 double lines per second, but the satellite footprint speed is 7.1km/sec, which requires permanent change of view direction to slow down angular speed. The resulting slowdown factor is 1.4 (Figure 3). The effective GSD as determined by point-spread analysis of sharp edges does not show loss of resolution against the nominal GSD, but it can be manipulated by contrast enhancement.

Radiometric Resolution
OrbView-3, Ikonos and QuickBird have a radiometric resolution of 11bit, with which 2,048 grey valu-es can be represented. However, the grey values within one scene will not cover the whole range and a qualified change from 11bit to 8bit grey values does not lead to significant loss of information. Only in some crucial areas do differences appear between the original 11bit and the derived 8bit grey values. Figure 4 shows more details in the roof in the original 11bit image than in its 8bit counterpart. This may be important for automatic image matching, but for mapping purposes it is unimportant because in both cases the building can be sufficiently well identified in all required detail.

Recording Conditions
Haze, clouds and smoke may reduce contrast; enhancement is possible but the resulting image quality will not approach that of images taken under optimal conditions. Sun elevation and azimuth cause shadows that hinder identification of details (Figure 5). With a sun elevation angle of 63°, shadows in the OrbView-3 image are not so long as in the Ikonos image with a sun elevation angle of 41°. Shadows cause identification problems in scenes with narrow streets, high buildings and terrain inclination, as is the case in the north of the Zonguldak area, but sometimes shadows may support object identification. For example, a helicopter landing-pad might at first sight look like a roof, but missing shadow may indicate that it is on the same level as surrounding grassland.

Terrain Characteristics
Contrast is the dominant component of image interpretation, but identification of objects also depends on their characteristics. Planned areas, with larger, well-arranged buildings can be more easily mapped than unplanned areas with smaller and irregu-lar objects, especially when the latter occur in hilly terrain (Figure 6). Identification of objects in planned areas does not result in significant differences between OrbView-3 and Ikonos panchromatic images, while in unplanned areas the better image quality of Ikonos resulted in a larger number of identified objects. Not every building has a rectangular shape and, particularly in hilly terrain, walls may not be parallel. Figure 7 shows a building of irregular shape (a), a rectangular building (c) and a low building throwing little shadow (b). The latter has not been identified during the mapping exercise, mainly because of missing shadow. OrbView-3 cannot take panchromatic and colour images simultaneously as do Ikonos and QuickBird, so no direct pan-sharpening was possible. Mapping with pan-sharpened Ikonos and QuickBird images simplified object identification, but this does not mean that more objects can be identified; the number was insignificant.

Results
Table 1 summarises the detection (DET) and recognition (REC) possibilities of features and objects in OrbView-3 and Ikonos imagery. Figure 8 shows maps created from panchromatic OrbView-3 and Ikonos images. All buildings and nearly all roads have been recognised in the Ikonos image; a few roads in shadowy areas have not been recognised. In the OrbView-3 mapping 93% of the buildings and 96% of the roads mapped with Ikonos are seen, while only 33% of the pavements could be identified. These results demonstrate that OrbView-3 images are well suited for creation of 1:10,000 topographic maps.

Biography of the Author(s)
Huseyin Topan is a PhD candidate for geodesy and photogrammetry in the Ýstanbul Technical University, Turkey. His main research direction is the infor-mation content and geometry of high-resolution space imagery.

Gürcan Büyüksalih is professor in Photogrammetry at Zonguldak Karaelmas University, Turkey. He received his PhD from the University of Glasgow, UK, Department of Geography and Topographic Science. His research direction is the full range of photogrammetry, especially application of space imagery.

Karsten Jacobsen received a PhD in Photogrammetry from Leibniz University, Hanover, Germany. He is academic director of the Institute of Photogrammetry and Geo-information at the same university. His main research area is numerical photogrammetry, especially the use of space imagery.

Raster Datasets

on July 21, 2009

Following raster datasets are available for at this plate form:

  1. Digital Elevation Model Data of whole Pakistan (SRTM 90m)AB
  2. Digital Elevation Model Data of whole Pakistan (GASTER DEM 30m)
  3. Satellite Image of Pakistan Flood 13 September 2010
  4. Satellite Image of Pakistan Flood 07 September 2010
  5. Satellite Image of Pakistan Flood 02 September 2010
  6. Satellite Image of Pakistan Flood 29 August 2010
  7. Satellite Image of Pakistan Flood 22 August 2010 
  8. Satellite Image of Pakistan Flood 17 August 2010
  9. Satellite Image of Pakistan Flood 15 August 2010
  10. Satellite Image of Pakistan Flood 12 August 2010
  11. Satellite Image of Pakistan Flood 11 August 2010
  12. Satellite Image of Pakistan Flood 10 August 2010
  13. Satellite Image of Pakistan Flood 08 August 2010
  14. Satellite Image of Pakistan Flood 30 July 2010
  15. Satellite Image of Pakistan Flood 28 August 2009
  16. Satellite Image of Pakistan Flood 14 August 2009 
  17. Satellite Image of Pakistan Flood 11 August 2009
  18. Geo-referenced Topographic maps of Pakistan
  19. Geo-referenced Satellite Image of Sialkot
  20. Satellite Map of Abbottabad City
  21. Satellite Image of Lahore City
  22. Satellite Image of Muredkey
  23. Satellite Image of Jhelum
  24. Satellite Image of Vehari
  25. Satellite Image of Liaqatput (Rahim yar Khan)
  26. Satellite Image of Faisalabad

Citiesimagessmall

Satellite Image of Pakistan Flood 13 September 2010

on July 17, 2009

Relying on NASA Earth Observatory on Natural Hazards, following image has been geo-referencing and converted to KML:

  1. 13 September 2010

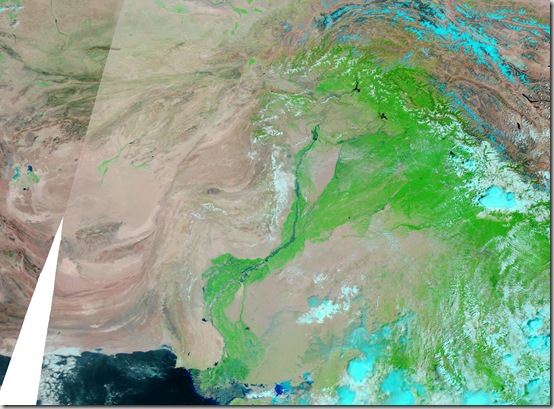
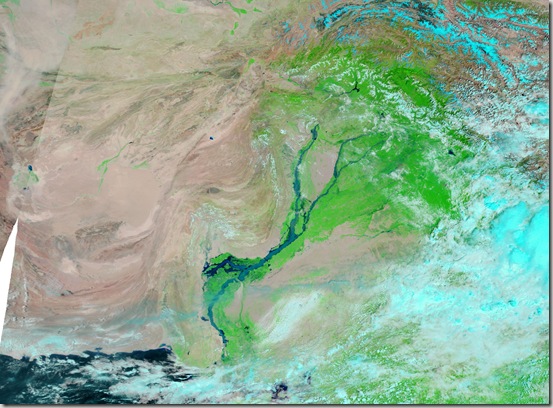
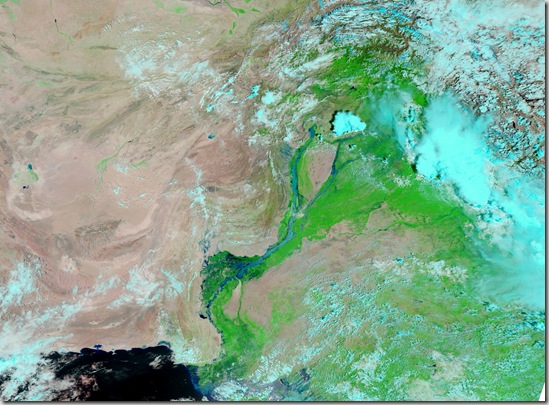
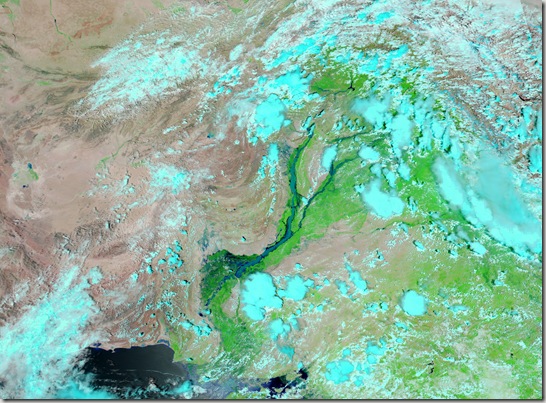
The Moderate Resolution Imaging Spectroradiometer (MODIS) on NASA’s Aqua satellite captured this image of Pakistan. This image uses a combination of infrared and visible light to increase the contrast between water and land. Water appears in varying shades of blue, vegetation is green, and bare ground is pinkish brown. Clouds are bright turquoise.

pakistan_amo_13 Sep 2010

                                          .::Click HERE to request for this data set::.

Satellite Images Pakistan Flood 28 August 2009

Relying on NASA Earth Observatory on Natural Hazards, following image has been geo-referencing and converted to KML:

  1. 28 August 2009

The Moderate Resolution Imaging Spectroradiometer (MODIS) on NASA’sAqua satellite captured this image of Pakistan. This image uses a combination of infrared and visible light to increase the contrast between water and land. Water appears in varying shades of blue, vegetation is green, and bare ground is pinkish brown. Clouds are bright turquoise.

pakistan_tmo_28 Aug 2009

                                    .::Click HERE to request for this data set::.

Satellite Image Pakistan Flood 22 August 2010

Relying on NASA Earth Observatory on Natural Hazards, following image has been geo-referencing and converted to KML:

  1. 22 August 2010

The Moderate Resolution Imaging Spectroradiometer (MODIS) on NASA’sAqua satellite captured this image of Pakistan. This image uses a combination of infrared and visible light to increase the contrast between water and land. Water appears in varying shades of blue, vegetation is green, and bare ground is pinkish brown. Clouds are bright turquoise.pakistan_tmo_22 Aug 2010

                                    .::Click HERE to request for this data set::.

Satellite Image Pakistan Flood 11 August 2009

Relying on NASA Earth Observatory on Natural Hazards, following image has been geo-referencing and converted to KML:

  1. 11 August 2009

The Moderate Resolution Imaging Spectroradiometer (MODIS) on NASA’sAqua satellite captured this image of Pakistan. This image uses a combination of infrared and visible light to increase the contrast between water and land. Water appears in varying shades of blue, vegetation is green, and bare ground is pinkish brown. Clouds are bright turquoise.

pakistan_amo_11 Aug 2009

                                   .::Click HERE to request for this data set::.

Satellite Image Pakistan Flood 11 August 2010

Relying on NASA Earth Observatory on Natural Hazards, following image has been geo-referencing and converted to KML:

  1. 11 August 2010

The Moderate Resolution Imaging Spectroradiometer (MODIS) on NASA’sAqua satellite captured this image of Pakistan. This image uses a combination of infrared and visible light to increase the contrast between water and land. Water appears in varying shades of blue, vegetation is green, and bare ground is pinkish brown. Clouds are bright turquoise.

pakistan_tmo_11 Aug 2010

                                           .::Click HERE to request for this data set::.

Satellite Image Pakistan Flood 12 August 2010

Relying on NASA Earth Observatory on Natural Hazards, following image has been geo-referencing and converted to KML:

  1. 12 August 2010

The Moderate Resolution Imaging Spectroradiometer (MODIS) on NASA’sAqua satellite captured this image of Pakistan. This image uses a combination of infrared and visible light to increase the contrast between water and land. Water appears in varying shades of blue, vegetation is green, and bare ground is pinkish brown. Clouds are bright turquoise.

pakistan_amo_12 Aug 2010

                                        .::Click HERE to request for this data set::.

Satellite Image Pakistan Flood 10 August 2010

Relying on NASA Earth Observatory on Natural Hazards, following image has been geo-referencing and converted to KML:

  1. 10 August 2010

The Moderate Resolution Imaging Spectroradiometer (MODIS) on NASA’sAqua satellite captured this image of Pakistan. This image uses a combination of infrared and visible light to increase the contrast between water and land. Water appears in varying shades of blue, vegetation is green, and bare ground is pinkish brown. Clouds are bright turquoise.

pakistan_amo_10 Aug 2010

                                        .::Click HERE to request for this data set::.

Satellite Image Pakistan Flood 08 August 2010

Relying on NASA Earth Observatory on Natural Hazards, following image has been geo-referencing and converted to KML:

  1. 08 August 2010

The Moderate Resolution Imaging Spectroradiometer (MODIS) on NASA’sAqua satellite captured this image of Pakistan. This image uses a combination of infrared and visible light to increase the contrast between water and land. Water appears in varying shades of blue, vegetation is green, and bare ground is pinkish brown. Clouds are bright turquoise.

pakistan_amo_08 Aug 2010

                                       .::Click HERE to request for this data set::.

Satellite Image Pakistan Flood 14 August 2009

Relying on NASA Earth Observatory on Natural Hazards, following image has been geo-referencing and converted to KML:

  1. 14 August 2009

The Moderate Resolution Imaging Spectroradiometer (MODIS) on NASA’sAqua satellite captured this image of Pakistan. This image uses a combination of infrared and visible light to increase the contrast between water and land. Water appears in varying shades of blue, vegetation is green, and bare ground is pinkish brown. Clouds are bright turquoise.

pakistan_amo_14 Aug 2009

                                        .::Click HERE to request for this data set::.

Satellite Image Pakistan Flood 15 August 2010

Relying on NASA Earth Observatory on Natural Hazards, following image has been geo-referencing and converted to KML:

  1. 15 August 2010

The Moderate Resolution Imaging Spectroradiometer (MODIS) on NASA’sAqua satellite captured this image of Pakistan. This image uses a combination of infrared and visible light to increase the contrast between water and land. Water appears in varying shades of blue, vegetation is green, and bare ground is pinkish brown. Clouds are bright turquoise.

pakistan_amo_15 Aug 2010

                                     .::Click HERE to request for this data set::.

Satellite Image Pakistan Flood 30 July 2010

Relying on NASA Earth Observatory on Natural Hazards, following image has been geo-referencing and converted to KML:

  1. 30 July 2010

The Moderate Resolution Imaging Spectroradiometer (MODIS) on NASA’sAqua satellite captured this image of Pakistan. This image uses a combination of infrared and visible light to increase the contrast between water and land. Water appears in varying shades of blue, vegetation is green, and bare ground is pinkish brown. Clouds are bright turquoise.

pakistan_amo_30 July 2010_lrg

                                         .::Click HERE to request for this data set::.

Satellite Image Pakistan Flood 17 August 2010

Relying on NASA Earth Observatory on Natural Hazards, following image has been geo-referencing and converted to KML:

  1. 17 August 2010

The Moderate Resolution Imaging Spectroradiometer (MODIS) on NASA’sAqua satellite captured this image of Pakistan. This image uses a combination of infrared and visible light to increase the contrast between water and land. Water appears in varying shades of blue, vegetation is green, and bare ground is pinkish brown. Clouds are bright turquoise.

pakistan_amo_17 Aug 2010_lrg

                                         .::Click HERE to request for this data set::.

Satellite Image Pakistan Flood 02 September 2010

on July 16, 2009

Relying on NASA Earth Observatory on Natural Hazards, following image has been geo-referencing and converted to KML:

  1. 02 September 2010

The Moderate Resolution Imaging Spectroradiometer (MODIS) on NASA’sAqua satellite captured this image of Pakistan. This image uses a combination of infrared and visible light to increase the contrast between water and land. Water appears in varying shades of blue, vegetation is green, and bare ground is pinkish brown. Clouds are bright turquoise.

pakistan_amo_02 Sep 2010

                                          .::Click HERE to request for this data set::.

Satellite Image Pakistan Flood 29 August 2010

on June 19, 2009

Relying on NASA Earth Observatory on Natural Hazards, following image has been geo-referencing and converted to KML:

  1. 29 August 2010

The Moderate Resolution Imaging Spectroradiometer (MODIS) on NASA’sAqua satellite captured this image of Pakistan. This image uses a combination of infrared and visible light to increase the contrast between water and land. Water appears in varying shades of blue, vegetation is green, and bare ground is pinkish brown. Clouds are bright turquoise.

pakistan_tmo_29 Aug 2010

                                          .::Click HERE to request for this data set::.

Satellite Image of Lahore

on March 05, 2009

Satellite image of Lahore at good resolution is available at PKMaps. These can be used for any GIS/RS assignment and analysis.

Source of quoted material: http://pkmaps.freeforums.org/lahore-satellite-imagery-at-18x-zoom-t31.html

You can find all the Yahoo imagery you need for mapping Lahore at 18x zoom level at the following RapidShare download link:


http://rapidshare.com/files/176314336/lahore_yahoo_satalite_1.zip
http://rapidshare.com/files/176316142/lahore_yahoo_satalite_2.zip
http://rapidshare.com/files/176317579/lahore_yahoo_satalite_3.zip
http://rapidshare.com/files/176320007/lahore_yahoo_satalite_4.zip
http://rapidshare.com/files/176322298/lahore_yahoo_satalite_5.zip
http://rapidshare.com/files/176321238/lahore_yahoo_satalite_6.zip
http://rapidshare.com/files/176324063/lahore_yahoo_satalite_7.zip
http://rapidshare.com/files/176325590/lahore_yahoo_satalite_8.zip
http://rapidshare.com/files/176324388/lahore_yahoo_satalite_9.zip

These zips contain the Ozi Explorer .map files and embeded merged images in jpeg format.
They have been downloaded from Yahoo using gMapMaker.
There are 9 files in total so that Lahore can be split up into 9 portions.
You can use these Ozi map files along with their image files in GPSMapEdit for your mapping.
Depending on where you unzip the file contects you may need to edit with a text editor the .jpg file path on 3rd line in each .map (Ozi Explorer file) to point to the right location of its associated .jpg file for the .map file to work.
The original jpeg tiles from Yahoo at 18x zoom downloaded by gMapMaker can be found at the following rapishare links:

http://rapidshare.com/files/176831705/yahoo_satallite_imagery_at_18x.part1.rar
http://rapidshare.com/files/176833586/yahoo_satallite_imagery_at_18x.part2.rar
http://rapidshare.com/files/176834619/yahoo_satallite_imagery_at_18x.part3.rar

PS: You will need to download all these .rar files and run winrar to extract them to one folder.
Mobile GMaps can users also benifit from these files.

Geo-referenced Satellite Image of Sialkot

on March 03, 2009

Please find here the Geo-referenced Aerial Photograph of Sialkot.

http://rapidshare.com/files/231074969/Sialkot.part1.rar
http://rapidshare.com/files/231086179/Sialkot.part2.rar

You need to download both files Sialkot.part1.rar and Sialkot.part2.rar and then unzip to gather. It will give you JPEG gile of sialkot city area along with .gmw file. The GMW is global mapper workspace file just like ozi explorer. You can use Global Mapper for its conversion to any format as per your need.

Following are the Image Details:

Image Date

9 October 2005

COVERED AREA

196.4 sq km

Download Eye Altitude

533 meters at Google Earth

DESCRIPTION

Sialkot Final.jpg


UPPER LEFT X

74.4745205570

UPPER LEFT Y

32.5547334337

LOWER RIGHT X

74.6323095316

LOWER RIGHT Y

32.4354937786


WEST LONGITUDE

74° 28' 28.2740" E

NORTH LATITUDE

32° 33' 17.0404" N

EAST LONGITUDE

74° 37' 56.3143" E

SOUTH LATITUDE

32° 26' 7.7776" N


PROJ_DESC

Geographic (Latitude/Longitude) / WGS84 / arc degrees

PROJ_DATUM

WGS84

PROJ_UNITS

arc degrees

EPSG_CODE

4326

NUM COLUMNS

24595

NUM ROWS

22105

PIXEL WIDTH

0.0000064 arc degrees

PIXEL HEIGHT

0.0000054 arc degrees

sialkot1

Satellite Map of Muredkey

on March 02, 2009

Please find here the high resolution Geo-referenced Aerial Photograph of Muredkey.

http://rapidshare.com/files/271703947/Muredkey_Satellite_Image.rar

Unzip after downloading. Folder will contain two .jpg with their calibration files for Global Mapper. You may adjust the image brightness using Photoshop but without disturbing the canvas size for a brighter image.

Below is the Metadata for the Image:

IMAGE DATE 29 August 2008

COVERED AREA

4623 acres

UPPER LEFT X

74.2348172500

UPPER LEFT Y

31.8199730000

LOWER RIGHT X

74.2726319615

LOWER RIGHT Y

31.7729982323

WEST LONGITUDE

74° 14' 5.3421" E

NORTH LATITUDE

31° 49' 11.9028" N

EAST LONGITUDE

74° 16' 21.4751" E

SOUTH LATITUDE

31° 46' 22.7936" N

PROJ_DESC

Geographic (Latitude/Longitude) / WGS84 / arc degrees

PROJ_DATUM

WGS84

PROJ_UNITS

arc degrees

COVERED AREA

4623 acres

NUM COLUMNS

8017

NUM ROWS

9959

NUM_BANDS

3

PIXEL WIDTH

0.0000047 arc degrees

PIXEL HEIGHT

0.0000047 arc degrees

PHOTOMETRIC

RGB Full-Color

BIT_DEPTH

24

ROWS_PER_STRIP

1

COMPRESSION

None

PIXEL_SCALE

( 4.71682e-006, 4.71682e-006, 1 )

MODEL_TYPE

Geographic lat-long system

RASTER_TYPE

Pixel is Area

SOURCE GOOGLE EARTH


image

Satellite Map of Abbottabad City

Here we present the satellite map of Abbottabad Urban Area. It is divided in 3 sheets named Eastern City area, Western City Area and Northern/Southern City area. This was initially developed by DLR Centre for Satellite Based Crisis Information and source of data was IKONOS Space Imaging 2005. Image Resolution is 0.6 meter and covers a total area of 23938 Acres. Detailed attributes of each sheet are as below:

FILE NAME

Abbottabad City Eastern Area

UPPER LEFT X

336963.835

UPPER LEFT Y

3784616.320

LOWER RIGHT X

342902.186

LOWER RIGHT Y

3780539.102

WEST LONGITUDE

73° 13' 50.5269" E

NORTH LATITUDE

34° 11' 26.5820" N

EAST LONGITUDE

73° 17' 45.0944" E

SOUTH LATITUDE

34° 09' 10.9852" N

PROJ_DESC

UTM Zone 43 / WGS84 / meters

PROJ_DATUM

WGS84

PROJ_UNITS

meters

COVERED AREA

5983 acres

NUM COLUMNS

9352

NUM ROWS

6421

NUM_BANDS

3

PIXEL WIDTH

0.635 meters

PIXEL HEIGHT

0.635 meters

PHOTOMETRIC

RGB Full-Color

BIT_DEPTH

24

ROWS_PER_STRIP

1

COMPRESSION

None

PIXEL_SCALE

( 0.634982, 0.634982, 1 )

TIEPOINTS

( 0.00, 0.00, 0.00 ) --> ( 336963.835, 3784616.320, 0.000 )

MODEL_TYPE

Projection Coordinate System

RASTER_TYPE

Pixel is Area

DOWNLOAD LINK Download
THUMBNAIL Abbottabad City eastern area


FILE NAME

Abbottabad City Western Area

UPPER LEFT X

333518.772

UPPER LEFT Y

3784953.773

LOWER RIGHT X

339461.919

LOWER RIGHT Y

3780874.533

WEST LONGITUDE

73° 11' 35.7603" E

NORTH LATITUDE

34° 11' 35.6452" N

EAST LONGITUDE

73° 15' 30.5772" E

SOUTH LATITUDE

34° 09' 19.9119" N

PROJ_DESC

UTM Zone 43 / WGS84 / meters

PROJ_DATUM

WGS84

PROJ_UNITS

meters

COVERED AREA

5991 acres

NUM COLUMNS

9352

NUM ROWS

6419

NUM_BANDS

3

PIXEL WIDTH

0.635 meters

PIXEL HEIGHT

0.635 meters

PHOTOMETRIC

RGB Full-Color

BIT_DEPTH

24

ROWS_PER_STRIP

1

COMPRESSION

None

PIXEL_SCALE

( 0.635495, 0.635495, 1 )

TIEPOINTS

( 0.00, 0.00, 0.00 ) --> ( 333518.772, 3784953.773, 0.000 )

MODEL_TYPE

Projection Coordinate System

RASTER_TYPE

Pixel is Area

DOWNLOAD LINK  Download
THUMBNAIL Abbottabad City western area


FILE NAME

Abbottabad City Northen Area

UPPER LEFT X

335861.470

UPPER LEFT Y

3788217.821

LOWER RIGHT X

341800.488

LOWER RIGHT Y

3784141.415

WEST LONGITUDE

73° 13' 5.0183" E

NORTH LATITUDE

34° 13' 22.8592" N

EAST LONGITUDE

73° 16' 59.7212" E

SOUTH LATITUDE

34° 11' 7.2634" N

PROJ_DESC

UTM Zone 43 / WGS84 / meters

PROJ_DATUM

WGS84

PROJ_UNITS

meters

COVERED AREA

5982 acres

NUM COLUMNS

9352

NUM ROWS

6419

NUM_BANDS

3

PIXEL WIDTH

0.635 meters

PIXEL HEIGHT

0.635 meters

PHOTOMETRIC

RGB Full-Color

BIT_DEPTH

24

ROWS_PER_STRIP

1

COMPRESSION

None

PIXEL_SCALE

( 0.635053, 0.635053, 1 )

TIEPOINTS

( 0.00, 0.00, 0.00 ) --> ( 335861.470, 3788217.821, 0.000 )

MODEL_TYPE

Projection Coordinate System

RASTER_TYPE

Pixel is Area

DOWNLOAD LINK  Download
THUMBNAIL Abbottabad City Northen area


DESCRIPTION

Abbottabad City Southern Area

UPPER LEFT X

333045.806

UPPER LEFT Y

3781673.534

LOWER RIGHT X

338985.426

LOWER RIGHT Y

3777597.586

WEST LONGITUDE

73° 11' 19.5657" E

NORTH LATITUDE

34° 09' 48.9301" N

EAST LONGITUDE

73° 15' 14.1652" E

SOUTH LATITUDE

34° 07' 33.2992" N

PROJ_DESC

UTM Zone 43 / WGS84 / meters

PROJ_DATUM

WGS84

PROJ_UNITS

meters

COVERED AREA

5982 acres

NUM COLUMNS

9354

NUM ROWS

6419

NUM_BANDS

3

PIXEL WIDTH

0.635 meters

PIXEL HEIGHT

0.635 meters

PHOTOMETRIC

RGB Full-Color

BIT_DEPTH

24

ROWS_PER_STRIP

1

COMPRESSION

None

PIXEL_SCALE

( 0.634982, 0.634982, 1 )

TIEPOINTS

( 0.00, 0.00, 0.00 ) --> ( 333045.806, 3781673.534, 0.000 )

MODEL_TYPE

Projection Coordinate System

RASTER_TYPE

Pixel is Area

DOWNLOAD LINK Same as above in Northern area sheet
THUMBNAIL Abbottabad City Southern area